STI - Where are you heading to?
Hi all, below is my view on the STI based on chart analysis.
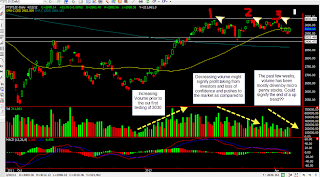
All in the picture.
We have tested the key resistance of 3030 thrice in a row but to no avail.
Each time with lower volume which signify decreasing investor confidence and more profit taking instead of strength buying.
Key support levels to take note will be 2920 and 2900 where majority of the counters then could be cheaper.
On the upside, if resistances such as 3030 is being tested again with low volume, do look at inverse ETF as your shorting tool. Otherwise, if 3030 is broken with strong volume, we can consider longing the STI ETF
Do comment!


