Posts

Showing posts from April, 2012

Update On Sakari (1)

Image
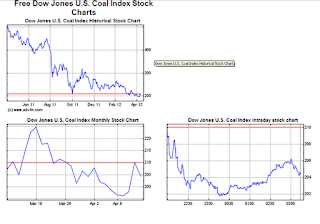
Below are some charts which shows the Dow Jones U.S. Coal Index Stock prices. Sakari  share price, together with the Dow Jones Coal Index prices have taken a hit. Coal spot price seems to have a support at 200 USD. Other  major U.S companies coal companies such as  Peabody  and  Alpha Natural  share prices are also on a declining trend as well. Coupled with slowing growth of China, which is a huge importer of coal, the outlook of  Sakari  does not seem to be as rosy as before. Just to take note as the Coal prices index  that i am using is  not  the Indonesia Coal spot prices, but valuation  As Coal prices seems to have rock bottom, it is best to avoid coal related companies at the moment. As  Sakari  is the only Coal company listed in SGX, investors can only gain exposure to coal related companies through them. Support/Resistance  at  2.100 ,  1.97-2.00  ,  1.800 . Do take note at these key support and resistance levels as potential reversals might occurs at these levels. Do t

Biosensors

Image
To my readers, biosensors plummeted yesterday from massive selling. It drops from a high of 1.565 to a low of 1.43 on the 17th of April. Eventually closing at 1.435. On the 18th, it opens at 1.45. Reaching a high of 1.48 before collasping at 1.46 at closing. So, what actually happened? from Nomura The share price of Biosensors pulled back today likely on a news report – “Biodegradable Stent Safe for Long-Term Treatment of Coronary Artery Disease”, Globe Newswire, 16 Apr 2012 – about safety issues surrounding biodegradable stents after a 10 year long clinical study. The limited clinical study showed the viability of a biodegradable stent for treating coronary artery disease. We believe the market reaction is misplaced. The idea of biodegradable stents is not new. Indeed back in January 2011, Abbott Labs received approval from the EU for its biodegradable ABSORB stent with the company looking to commercialize it in late 2012 or 2013. Meanwhile Abbott is doing further trials to su

STI - Where are you heading to?

Image
Hi all, below is my view on the STI based on chart analysis. All in the picture. We have tested the key resistance of 3030 thrice in a row but to no avail. Each time with lower volume which signify decreasing investor confidence and more profit taking instead of strength buying. Key support levels to take note will be 2920 and 2900 where majority of the counters then could be cheaper. On the upside, if resistances such as 3030 is being tested again with low volume, do look at inverse ETF as your shorting tool. Otherwise, if 3030 is broken with strong volume, we can consider longing the STI ETF Do comment!

Sakari - Potential Breaking Out or Slump Continuation

Image
To my readers, Attached above is a chart for Sakari. Sakari has been on a very strong decline recently, ever since the expiry of their warrant (more than 1 month back)  Then, the warrant strike price was 2.7 and it pushes sakari to its high at around 2.7ish and 2.6ish for that week Since then sakari has been on a slump as you can see. Looking at the chart, Sakari has been trading on a decline, chart above is H1. However, possible scenarios will be trend breaking, coupled with strong volume to push its current price out of declining trend pattern formation.  Alternative scenario will be ( look at picture 3), where it could possibly retrace and touches it fibo retracement support at around 1.97-2 dollar, then we can really take at another look on Sakari. So, where will you be if you are keen on some Sakari play? Have this counter on your watch list as this high beta stock can potentially give you a good ride!!