Sakari - Potential Breaking Out or Slump Continuation
Sakari has been on a very strong decline recently, ever since the expiry of their warrant (more than 1 month back)
Then, the warrant strike price was 2.7 and it pushes sakari to its high at around 2.7ish and 2.6ish for that week
Since then sakari has been on a slump as you can see.
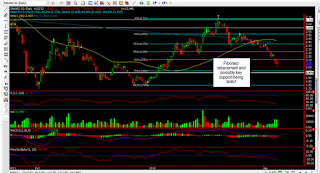
Looking at the chart, Sakari has been trading on a decline, chart above is H1.
However, possible scenarios will be trend breaking, coupled with strong volume to push its current price out of declining trend pattern formation.
Alternative scenario will be ( look at picture 3), where it could possibly retrace and touches it fibo retracement support at around 1.97-2 dollar, then we can really take at another look on Sakari.
So, where will you be if you are keen on some Sakari play? Have this counter on your watch list as this high beta stock can potentially give you a good ride!!


Comments
Post a Comment