Posts

Showing posts from November, 2012

United Engineer - Diary Post

Image
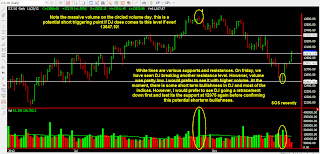
Emailed my clients about UE breakout trade on Thursday. Image is chart on Thursday. I did not tell my clients much as most of them are non-TA practioners. Price has now up by 8 cents. How far up will it go? $2.80 and recapture new high? Why not? 100 years special dividend incoming? Perhaps... However, most peole who follow my blog know that I am not a breakout trader, but seeing the strength behind UE... I thought it is reasonable to still have some upside.

Yanlord Diary Post - 29/11/2012

Image
 Very nice setup. Note to self : A very nice application on trending stock near the slant trend line.

Olam - One minute chart since resume trading

Image

Muddy Water Strikes Back Finally - Will Olam Drops The Ball?

In summary, from MW report summary :   Initiating Coverage on Olam International – Strong Sell Published: November 26, 2012 Muddy Waters rates Olam International (SGX:O32; OTC:OLMIY/OLMIF) shares a Strong Sell. In this latest report Muddy Waters highlights how: Olam runs a high risk of failure. Its “asset heavy” strategy appears to be an off-the-rails CapEx and acquisition binge. Management talks about the “gestation” of these projects, but our research makes clear that they are marred by incompetence and perhaps significant misconduct. The vast majority of the acquisitions we have researched are of low quality assets that appear to bring little more than cosmetic benefits to Olam. In short, these projects are “pie in the sky” that we strongly believe are destroying substantial amounts of capital. Bond holders in particular should be asking where their money goes (and how they will get it back). Olam has spent S$571.0 million less on acquisitions than announced. However, it

MDR - Myanmar Play

Below is a forwarded email for my clients on mDR......  RE  :mDR joint venture in Myanmar 2 & SINGTEL's possible licensing in Myanmar Gathered more informations on the Myanmar Golden Star Group, which owns GMS. As quoted below... "The JVC will also provide exclusive consultancy and retail franchisee procurement services to Myanmar-based Golden Myanmar Sea Co. Limited (“GMS Co. Ltd”), which will be involved in the mobile devices and accessories distribution and retail businesses. GMS Co. Ltd is owned by the Myanmar Golden Star Group in Myanmar, an established business conglomerate involved in diverse businesses in Myanmar such as food, alcoholic and non-alcoholic beverages, financial and medical services, farming, agricultural and natural resources, aviation, and consumer electronics trading and distribution." A huge conglomerate with diversified businessess. http://www.mgsgroup.net/   -> (group website) MORE IMPORTANTLY.... Below is quoted from the pd

Diary post - Wilmar

Image
Additional commment : Immediate resistance will be at $3.20, forget to add the line in. Just to add on, notice the behaviour of the upper slant trend line when Wilmar is trading close to it...we always see major signs of weakness...

HoBee - Diary Post

Image
HoBee momentum continues, very strong infact. I feel that breaking 1.6 should be of no problem. The question is when it will break the $1.70. As long as macro outlook stabilies, HoBee could move to higher high and break the $1.60 resistances that is currently facing now. Too many good signals in the last 20 trading days. Until I see weakness in the setup, investors that has Hobee should continue to ride it. Broke 1.62 convincingly and BB just ate 527 lots at 1.62. 29/11/2012
Image

On YHM

Thoughts on YHM : Before the day of announcement which is scheduled tomorrow. YHM share prices took a massive hit. Definitely, the move is unfavourable for the existing shareholders. Buying at a hefty premium price of 0.04++ while ezion is getting lesser than 0.002. But, this is how the stock market reacts. Herders chase and Chng Kay is always the one operating behind it. Good job on YHM BB, well done.

Diary post on STI and DJ

Image
Short term bullishness but long term weakness.

Diary post on 25/11/2012

Image
Update on 26 November 1.07am : There are many other counters that I am currently watching, these are just 6 of them I am analysing. In order of confident, Yoma, STX OSV, Genting HK, TigerAir, IEV then Cordlife.  Other counters that are worth monitoring are, Ausgroup, Ezion, Aspial and Amtek.

Trade Diary 11/24/2012 - Bumitama SOS and SembCorp Update

Image
A pity that a friend from facebook exited his long position @ 1.03. I thought this was a very strong set-up in the first place that has really good risk to reward ratio. He exited after the result from Bumi. Lesson learnt? Never look at news. Charts tell you everything. Next, on SembCorp, it does show some kind of weakness on Friday. I blogged about it a few days ago that I do not like its high volume down bar.

SembCorp Diary Post 11/23

Image
volume was higher at the test like bar. If volume was lower, than i will be more comfortable. I am still more negative biased due to 21st November high volume bar. While it closes at high today. My take is due to the thanksgiving day probably SM wouldnt see US disturbing a 1-2 days mini-rally. MY TAKE IS STILL A NEGATIVE CALL UNTIL LOWER VOLUME WAS WITNESSED AT THE PREVIOUS TEST BAR.

DMX Tech - Trading ideas.

Image
Just sharing one stock that could be in accumulation mode. Please seek your advice from your FA/Broker/Remiser before placing any trades. I will not bear resposbility for any of my postings.

Hiatus

Image
Taking a break from posting as market is too too too boring to worth the time monitoring the stocks. I only monitor around 50 over ++ counters everyday, they are usually comrprises of those top volumer ( above 20cents), some mid caps and a few STI components. From a daily chart perspective, you might want to change to a weekly perspective from now on as I think it could probably give you a more accurate picture for now. Personally, I feel that the market should be trending lower in the future.  Till I see some "trigger actions" in the market, I will then continue to start posting again. If you have a CFD account, perhaps this is the time to utilize them very soon ;) Meanwhile, if you are keen on picking up some new technical chart skills, do go to  http://harmonicforex.com and give it a try on harmonic trading for FX. I will end off with some chart posts on STI.

Gallant Ventures - At bottom of the range trend?

Image
Gallant has been range trading for quite the past 1 year.... I feel that a good risk to reward ratio is present in current Gallant's share prices. Disclaimer :  This is not a buy/sell call

SembCorp Industrial - Stopping Volume

Image
Good evening all, Recently, due to Sembcorp Marine dismal result, Sembcorp industrial price took a heavy hit. Sembcorp owns about 60% of SembMarine shares. Revenues wise, SembMar contributes roughly about 40+ percent of their revenue to SembCorp. Price of SembCorp has fallen more than 7% since the release of Sembcorp Marine result. From 5.40 to around 5.00 at the moment. Today, SembCorp Industrial closes strong at $5.04. The last 3 days, we have seen very heavy volume on SembCorp Industrial, especially on Tuesday and Wednesday. Please see chart for detailed explanation. Looking at how SembCorp Ind behaves for the past few days.... Potential scenarios : If Semb Corp financial result is gd + Macro condition is viable for a technical rebound..... If Everything is chui....

SembCorp Marine

G

AusGroup - When 2 becomes one

Image
Good evening all, This post is just educational and I hope to be able to do more back testing with regards to this kind of setup. Do inform me if you see more setup like these.. =p I will call this setup advance stopping volume. As this is the only example that I came across so far. I hope to back test more of these patterns in the future. I will following closely on Ausgroup and I witness the low volume bar. As mentioned below, it seems to me like a no supply bar to me, but, because of the low volume accumulation/down move on the previous bars, I was not convinced by the no supply bar. Nonetheless, keep watch, keep trading. @11Nov 6pm Happy Deepvali and happy holiday to all readers, An update on Ausgroup, Since i last blogged on Ausgroup, we witness a test bar/no supply bar again @ 8Nov2012. The test bar clearly tested positively that there is very little supply on the bar on 6th Nov. On 9 Nov, next bar showed decent strength as it closes higher than the test/no sup

Interra Resources - Signs of Weakness?

Image
Interra Resources This is not a buy/sell call. Below is my own personal opinion on Interra Resource and I am not very bullish in the short term for Interra Resource. One of my favourite Myanmar Boys : Interra Resources. Has been on a clear down trend since its first sign of weakness appear on 2nd October. White lines are its supports and resistances. Discussion will be on its hourly chart. Additional comment : While I am negative on Interra Resource. I will be looking out for any tests at 36 cents and 32 cents. 36 cents was a previous resistance when market pushes through it with ultra high volume. We should be able to see a huge support at 36cents. As for 32 cents, it was previous the support level when it was range trading.

Midas - Potential Stopping Volume?

Image
Good Saturday all, Below is my thoughts on Midas. Not a buy/sell call. Result of Midas will be out on 14 Nov. Additional comment : Yesterday upbar means nothing to me. While indeed it shows strength, but supply has to be cleared then Midas can see 40+ cents back again. So, waiting for a down day to observe its strength. Blue lines are my fibo lines While the last 2 candles exhibit decent strength in the activities. The market may need to accumulate further before an up move. Patience is the key. In the future : Look out for tests and shakeouts. (Will complete the shakeout tabs soon, tabs still under construction). Ideally, tests and shakeouts shall challenge Midas recent low around 37.5 cents with low volume. Hourly chart and what I am expecting to see with a test bar. Update on 5th Nov, Midas looking pretty normal today. I am still upside bullish and more supply was taken out today! Imminent movement soon? Update On 14Nov : Despite the pr

Biosensors - Wait for further confirmation

Image
Biosensors Above chart is hourly. The Long candle on the hourly chart does look buillish in the short term.But, Biosensors is on a clear down trend since it touches its high of about $1.70. Total volume for the day was not the kind of ultra high volume that I am looking for. A good test at $1.00 could be attractive. Update on 11:36am Friday : Very bullish and breaks my yesterday top of 1.085. Currently resting at $1.10. Short term bullishnedd exists but major trend is still down.

Genting SP

Image
 looking gd 1.34 Above comment was posted around in the afternoon. Genting SP does look good as it closes at high, 1.345. Below is hourly chart and my comments. Daily chart and comments. Caution : Don't ever hold through results which will be released on 12Nov, after market closes. This is not a buy/sell call. Update on 11/3 : Upthrust on 11/2. Not looking at the moment.