On Stocks Trading Technique
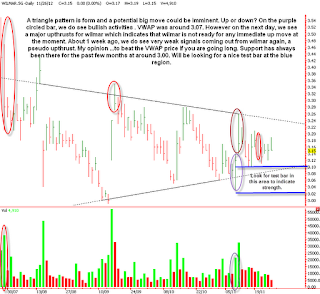
On Geo Energy and future chart ...
Other than the obvious consolidation that can been rather straight forward from the chart...but there are times that this kind of long period of consolidation can easily fails...one classic example is innopac where it ding dongs sideways for so long before 20 cents was broken and it is currently trading at 18.9 cents at the moment.
What I'm trying to say is that not all charts that move sideways = accumulation = good. If only trading is that easy....everyone will be happier and has fat pocket.


Comments
Post a Comment