Yanlord - Breaking out?
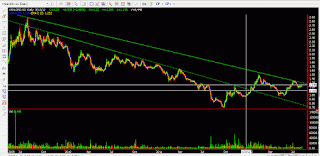
Below is a macro-picture view on Yanlord. It has been on a declining trend line over the past 3 years.
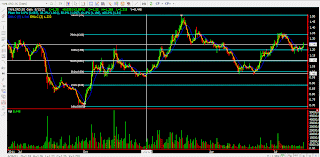
Looking at its 1 year chart, this is what we see
White line represent support/resistance lines and the blue lines are fibo retracement lines. These are levels that I usually like to identify before I attempt to look at the chart in more details. It is always very important to highlight the area of very strong support and resistance in making your trading decisions.
If you have been following my charts, you always see this blue and yellow lines in my chart presentation. They are my sensitivity MAs. Yellow MA is a 3 day exponential MA and the blue MA is a 9 day Normal MA. Basically, i use them like how people uses golden cross and death cross. Rationale for using this 3 day expo and 9 day normal? It helps me to identify sensitivity in a particular stock due to its recent share price movement. Could be a start of a up/down trend.
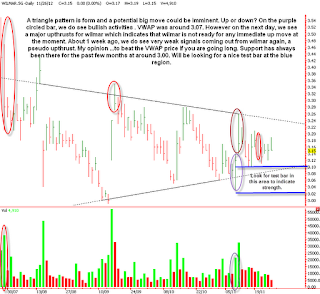
See Pic3
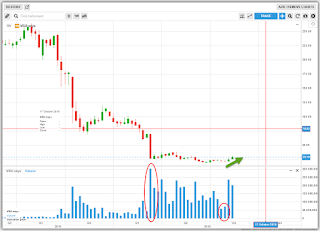
The last pic shows the price on volume chart. It seems that resistance could be weak, looking at the volume zone @ price 1.25 - 1.30
Like all other posts, this is not a buy/sell recommendation.


Comments
Post a Comment