Posts

Volume Spread Analysis

Been updating more on my blog recently to kill my boredom @ work. This time round not about charts because I am waiting for the huge fiscal cliff to kaboom! So meanwhile, posting some educational VSA materials. If you haven't been looking at the tabs that i created, do it now!  They are some key principles of VSA. The dos and the donts. What to see and what to take note of what in the future. Anyway, hope all of you can learn VSA with me together, I am learning while I am posting them too.  Rest assured that most of the things i posted here have been very much digested by myself and my experiences so far in the markets. I have read through tons of materials and videos. Hopefully that by sharing, all of us can learn together and be a better investor/trader. If you want to clarify/discuss on any principles, just leave a comment. Very much appreciated. Hongwei

KSH Holdings

Image
Disclaimer : This is my personal opinon on KSH holdings. It is not a buy/sell call. For all trades, please have your own Stop loss and Profit taking level. I will not be responsible for any losses that you made. This is merely for my own interest and sharing. KSH Holdings result will be out on 2 Nov. KSH is a well established construction, property development and property management group with operations in Singapore, Malaysia and the PRC. Our Group's principal activities are as follows:- construction in Singapore and Malaysia; and property development and property management in the PRC. We act as main contractors in construction projects for private and public sector customers in Singapore and for private sector customers in Malaysia. (ShareinvestorI.com) Full analysis based on charting is on the image below. Future : 31.5 cents - 32 cents seems to be zone of accumulation. Will be looking out for a test bar again, any confirmation of a test will indicate strengths and ...

Facebook

Image
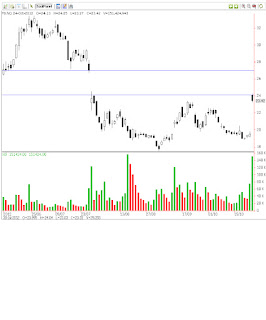
Facebook lastest quarter result beats analysts estimates as revenue from mobile ads chalked up 14% of its total revenue. Yesterday, we see a down bar with massive profit taking. Immense selling pressure was witnessed. FB opens at a high of $24.13 and close at $23.42. Take note of the fierce gapped down some months back. The selling pressure over there has to be tested before FB can challenge analyst TP of >$27. Future : The worse seems to be over for Facebook, but do not buy into impulse as well. Waiting for better indicatiors.... Download link to their reports : https://hotfile.com/list/2114430/7207caa Excerpts from some research reports that I saw: From Nomura Securities : Like GOOG, the shift toward mobile was front and center, as 14% of FB’s 3Q ad revenue came from mobile….up from 0% in February when FB initially started testing mobile sponsored stories. While this ~$152mn in quarterly mobile ad revenue is still small compared to Google’s ~$2bn, not...

Dyna-Mac

Image
Insiders probably pushes the shares up before its shares placement at 50 cents to get maximum value of its shares placement, which was at 50 cents. Looking at Dyna-mac today. Ever since its placement shares came out at 50 cents, Dyna-mac has been under immense selling pressure since then. Last Friday, 10/19, we see Dyna-mac falling close to its support level at 45cents with huge volume. Today, we seen Dyna-Mac closing back up again, this time round with lesser volume. The relatively lesser volume could potentially indicates lesser selling pressure and the stopping volume last Friday could indicates absorption from the professionals. Dynamac 3 years chart Last Friday, 10/19, we see Dyna-mac falling close to its support level at 45cents with huge volume. Today, we seen Dyna-Mac closing back up again, this time round with lesser volume. The relatively lesser volume could potentially indicates lesser selling pressure and the stopping volume last Friday could indicate...

A pattern not to forget - Yoma's Case Study

Image
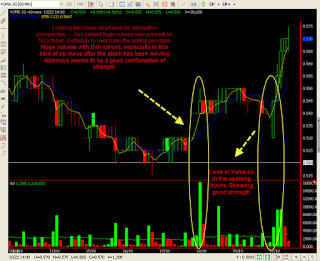
A takeoff from where I left off : VSA or volume spread analysis is not easy to grasp. Trading is never easy.I am re-learning everything and after extensive reading and watching of videos last 2 weeks, I definitely gained more insights and confidence in applications. I hope to share most of the things with the readers here. At the moment, due  studying and poor knowledge of IT ( I do not know how to upload stuffs in the net for downloading) (Excuse... =p) People have different philosophy in trading, mine is using volume as the leading indicator in getting price entries. I am still refining my technique at the moment. However, If you are interested in sparing knowledge using VSA or ask anything relevant to it, I hope to help you. Just send me a fb msg/email me. Lastly, sorry for the lack of updates. Next, I shall share with you Yoma using VSA analysis again. This stock is perfect for VSA analysis reason being that it is pretty much rigged, manipulated, cornered wh...

TigerAir

On a stealth accumulation process. Waiting for a "test" bar.

Good Morning 051012

STX OSV, THEBEV making a come back soon? Let's see Edited : Chinaminzhong looking gd too. Will be looking at retracement

Yanlord & C-land

Strong buying activity for this 2 counter. I am particularly interested in YL. As for C-land, due to the 3.3 resistance, might hover around that area.

Yoma

Been looking at Yoma for the past few days. My thoughts for Yoma : Very speculative counter, but could potential reap more rewards. Both OCBC and DBS has issued buy call on Yoma, @  with fair value at 45 cents and 60 respectively. Before DBS released its result, Yoma went up crazily from 44.5 cents to 48 cents closed. The next day, we saw DBS issue its buy call on Yoma. I have been trying to get my client's attention for this counter when it was trading around 40 cents. On hindsight, accumulation was seen around 37-38 cents, the first wave. 42-43 cents in the second wave. Perfect textbook accumulation. Why didn't I get in then? I was not confident enough and also because of the nature of my job, it restricts me. Still exploring a good trading technique using VSA. Excuses... Anyway, my take for Yoma : As long as price maintains around this current level of 54.5 - 55.5 cents for the next few days. We might see the last wave of Yoma explosion. Things to take no...

Ezra and Kepland

Image
Ezra caught my attention today. Below is its 1 year chart. Trading just above my resistance turned support level @ 1.22 today. Yesterday, Ezra has strong trading volume. Lots of buying up activities. If we take a look at its trading activities for the past 3 days... I will update them again when I am back home. But tentatively, this 2 stocks are looking good.

Comments On Market 17 September

Market could be heading south. I do not see any real strong buying in most of the counters. A lot of profit takings happened in many counters that I have been observing. Do wait for the long due correction if you want to be really safe. I expect in the mid term, 2-3 months, market could still be okay to long. But, after the 2 days of intense rallying, we probably need to rest.

Potential New Contract - YongNam

Image
A forwarded sent to my clts Market has not been responding very well for the past few weeks. I am more negative biased in the market at the moment due to Euro woes. However,   YONGNAM   has caught my attention recently. First of all, some background information about YongNam :   Yongnam Holdings Limited is a leading Singapore based multi-discipline engineering and construction services provider with more than 30 years experience. Its key business areas include that of structural steelworks (engineering coordination, detailing, full service fabrication and erection of steel structures), specialist civil engineering and mechanical engineering. Yongnam currently has regional operations in Singapore, Malaysia, Thailand and Hong Kong. Yongnam past projects will also include MBS'sSkypark, ArtScience Museum at the Marina Bay Sands Integrated Resort.   Yongnam was awarded numerous contracts for developing MRT lines as well.   Below is one of them ...

United Engineers

Image
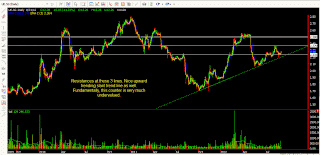
After friday's closing, i noticed of UE E&C strong buying volume which causes the stock to be up by 9+ % at the end of the day. I took a look at its parent company and it was its parent company that caught my attention instead. Better risk to reward ratio with solid fundamentals. Below is its 3 years chart. If we take a closer look at its activities recently year, there is a lot of hidden potential in UE in my opinion. Fundamentally at a glance, UE looks very good.

TigerAir - 2

Image
Continuation from my tiger post. Today, Tiger showed another SOS again today. What we expecture in the near future : Further testing of supply so that SM can pushes it higher. Today, we witnessed strong selling pressure. However, I will not conclude that the we have a winner from the bear/bull yet. Much remains to be seen. Never underestimate a hidden SM, selling in the background. Test candle bars will be good or moving sideways in the region of 0.745-0.755. Again, above is not a buy/sell recommendation. Do invest within your means. Always have a SL and  TP in mind.

TigerAir

Image
Tiger Air seems to be undergoing steady reforming.  Fundamentally, a lot of companies has change/upgrade their call on TigerAir based on their lastest financial earnings. Technically.... I Missed a very convincing buy signal on Wednesday. ( Monitor too many stocks) Wednesday..Low volume test successful. Warrant a convincing buy. Stock is also on a uptrend and we could potentially challenge the upper trend line again. More upside ahead. If you look at the transacted value. Very strong buying, 200-500 lots single transaction. Clearing levels from 0.725-0.750. Will be looking at retracement and see how the BB's intends to play. 

ChinaMinZhong and Gen SP

Image
The last post tonight. Do take note of Indoagri as well, respectable result 2Q result and nice TA. While I cited a no demand Bar for Chinaminzhong after its buying climax which did happened. But, over the last 5 days,we witness CMZ going into hibernation modewith low volume with thin spread...(arguably either accumulation/no demand/ combination of both) CMZ volume exploded today, trending into familiar territories of the past. 70cents again! In my opinion, SM has put in a lot of effort today and we might see a continuation of this effort again tomorrow likely. As this counter has previously free fall 80+ cents to 60+ cents in just a couple of days, we might potentially see ChinaMinZhong challenging the 80 cents region very soon with strong BB/SM play. Today could potentially be he first day of its rally to 80 cents. Next, we have Genting SP. Below is its chart. TYPO : Spread seems covered should be " GAP" seems covered instead. Genting SP volume wasn't very ...

YangZiJiang

Image
 Fundamentally, one of the better shipping company around. Despite tough condition for China shipping industry, Yangzijiang's recent result is in line with expectation for most of the research houses. One of the lowest P/E ratio shipping company at the moment, (w china exposure). If you a fundamentalist, you can also consider this counter as they also do give good dividend. From historical data, their dividend works out to be around 5.00+ percent as of current price. However, their announcement date for their dividend usually comes at Feb. Definitely a good counter to buy if you are a fundamentalist, looking at exposure to shipping industry with decent dividend. If you a trader, the more you should look at the 2 charts below Too much typo for Chart 2. Read Below for Chart 2 Been observing Yang since the reverse upthrust spotted 7 trading days ago. Prices went down before closing up at huge volume. Showing significant buying strength from the SM. The next da...

Cosco

Image
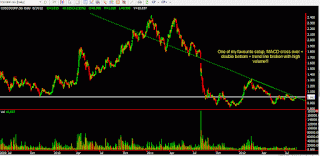
After today mini-rally, I have unearthed some counters that have decent risk to reward ratio. Disclaimer : Below is not a buy/sell recommendation We will attempt to see Coscocorp in different time frames. Favourite setup. Need no explaination. Today, SM pushes Coscocorp up with huge buying volume as seen at the hourly chart. Has the gap be filled? That's the question.... Blue lines are fibo retracement lines which can be deemed as support for Cosco

Yanlord - Breaking out?

Image
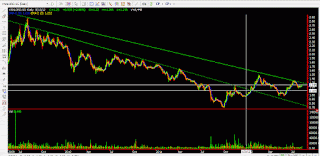
Below is a macro-picture view on Yanlord. It has been on a declining trend line over the past 3 years. Looking at its 1 year chart, this is what we see White line represent support/resistance lines and the blue lines are fibo retracement lines. These are levels that I usually like to identify before I attempt to look at the chart in more details. It is always very important to highlight the area of very strong support and resistance in making your trading decisions. If you have been following my charts, you always see this blue and yellow lines in my chart presentation. They are my sensitivity MAs. Yellow MA is a 3 day exponential MA and the blue MA is a 9 day Normal MA. Basically, i use them like how people uses golden cross and death cross. Rationale for using this 3 day expo and 9 day normal? It helps me to identify sensitivity in a particular stock due to its recent share price movement. Could be a start of a up/down trend. See Pic3 The last pic sho...

Our STI - A number's game

View on the article below To add on, the heavy weight counters such as the 3 banks, 3 jardines, hk land, FNN, singtel has been doing relatively well to the sinking  ships such as wilmar,noble etc. These heavy weight counters constitutes about at least 50% of the STI. So, if you think STI is at its high now? Think again, dont be fooled by the numbers. (from fb post) The lastest financial result from the majority commodities stocks are not doing exactly what investor want. If you are still keen on going  on them, do have a stop loss in mind. Why you might think commodities are already on their low, they can always go lower. If you already have long positions in some of these highly volatile counters, the best strategy could be doing a hedge against it. from :  http://www.businesstimes.com. sg/premium/top-stories/dont- confuse-sti-market Don't confuse STI with the market  -  On Aug 6, the index closed at a 12-month high but, at the same time, 9 in ...