Posts

Showing posts from August, 2012

TigerAir - 2

Image
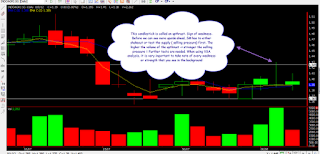
Continuation from my tiger post. Today, Tiger showed another SOS again today. What we expecture in the near future : Further testing of supply so that SM can pushes it higher. Today, we witnessed strong selling pressure. However, I will not conclude that the we have a winner from the bear/bull yet. Much remains to be seen. Never underestimate a hidden SM, selling in the background. Test candle bars will be good or moving sideways in the region of 0.745-0.755. Again, above is not a buy/sell recommendation. Do invest within your means. Always have a SL and  TP in mind.

TigerAir

Image
Tiger Air seems to be undergoing steady reforming.  Fundamentally, a lot of companies has change/upgrade their call on TigerAir based on their lastest financial earnings. Technically.... I Missed a very convincing buy signal on Wednesday. ( Monitor too many stocks) Wednesday..Low volume test successful. Warrant a convincing buy. Stock is also on a uptrend and we could potentially challenge the upper trend line again. More upside ahead. If you look at the transacted value. Very strong buying, 200-500 lots single transaction. Clearing levels from 0.725-0.750. Will be looking at retracement and see how the BB's intends to play. 

ChinaMinZhong and Gen SP

Image
The last post tonight. Do take note of Indoagri as well, respectable result 2Q result and nice TA. While I cited a no demand Bar for Chinaminzhong after its buying climax which did happened. But, over the last 5 days,we witness CMZ going into hibernation modewith low volume with thin spread...(arguably either accumulation/no demand/ combination of both) CMZ volume exploded today, trending into familiar territories of the past. 70cents again! In my opinion, SM has put in a lot of effort today and we might see a continuation of this effort again tomorrow likely. As this counter has previously free fall 80+ cents to 60+ cents in just a couple of days, we might potentially see ChinaMinZhong challenging the 80 cents region very soon with strong BB/SM play. Today could potentially be he first day of its rally to 80 cents. Next, we have Genting SP. Below is its chart. TYPO : Spread seems covered should be " GAP" seems covered instead. Genting SP volume wasn't very

YangZiJiang

Image
 Fundamentally, one of the better shipping company around. Despite tough condition for China shipping industry, Yangzijiang's recent result is in line with expectation for most of the research houses. One of the lowest P/E ratio shipping company at the moment, (w china exposure). If you a fundamentalist, you can also consider this counter as they also do give good dividend. From historical data, their dividend works out to be around 5.00+ percent as of current price. However, their announcement date for their dividend usually comes at Feb. Definitely a good counter to buy if you are a fundamentalist, looking at exposure to shipping industry with decent dividend. If you a trader, the more you should look at the 2 charts below Too much typo for Chart 2. Read Below for Chart 2 Been observing Yang since the reverse upthrust spotted 7 trading days ago. Prices went down before closing up at huge volume. Showing significant buying strength from the SM. The next day, we

Cosco

Image
After today mini-rally, I have unearthed some counters that have decent risk to reward ratio. Disclaimer : Below is not a buy/sell recommendation We will attempt to see Coscocorp in different time frames. Favourite setup. Need no explaination. Today, SM pushes Coscocorp up with huge buying volume as seen at the hourly chart. Has the gap be filled? That's the question.... Blue lines are fibo retracement lines which can be deemed as support for Cosco

Yanlord - Breaking out?

Image
Below is a macro-picture view on Yanlord. It has been on a declining trend line over the past 3 years. Looking at its 1 year chart, this is what we see White line represent support/resistance lines and the blue lines are fibo retracement lines. These are levels that I usually like to identify before I attempt to look at the chart in more details. It is always very important to highlight the area of very strong support and resistance in making your trading decisions. If you have been following my charts, you always see this blue and yellow lines in my chart presentation. They are my sensitivity MAs. Yellow MA is a 3 day exponential MA and the blue MA is a 9 day Normal MA. Basically, i use them like how people uses golden cross and death cross. Rationale for using this 3 day expo and 9 day normal? It helps me to identify sensitivity in a particular stock due to its recent share price movement. Could be a start of a up/down trend. See Pic3 The last pic shows t

Our STI - A number's game

View on the article below To add on, the heavy weight counters such as the 3 banks, 3 jardines, hk land, FNN, singtel has been doing relatively well to the sinking  ships such as wilmar,noble etc. These heavy weight counters constitutes about at least 50% of the STI. So, if you think STI is at its high now? Think again, dont be fooled by the numbers. (from fb post) The lastest financial result from the majority commodities stocks are not doing exactly what investor want. If you are still keen on going  on them, do have a stop loss in mind. Why you might think commodities are already on their low, they can always go lower. If you already have long positions in some of these highly volatile counters, the best strategy could be doing a hedge against it. from :  http://www.businesstimes.com. sg/premium/top-stories/dont- confuse-sti-market Don't confuse STI with the market  -  On Aug 6, the index closed at a 12-month high but, at the same time, 9 in 10 stocks were down

NOL

Image
First of all, appreciate the viewers that have been looking at my posts. Spread the words. I will be coming up with some handy materials for VSA very soon once i configured how to do it!( sux at html) I will provide some useful download links for you all. Meanwhile, if anybody wants the materials, drop me a FB or leave me with your email. I hope this blog can be a one-stop VSA portal for everyone who trades in the Singapore market and also for everyone to learn VSA. NOL again! The reason why I cover this counter is because this is probably one of the best trading counter in the STI components. Who don't like beta and volatility? =D Also, there has been a lot of footprints created by the SM for NOL and the high volume huge candle stick on Friday! This is fantastic for a VSA analysis. The last 2 weeks, we witness 2 signs of strength on 2 occassions, as seen from the picture above. Lets examine what happened in SOS 1. Huge volume was accumulated at SOS (signs

Sakari and NOL

Firstly, Sakari... Our last post left off from where Sakari will be heading to, Below are my 3 possible options. What to take note in the future :  1) Further shakeout to drive investor might occur. 2) Thin spread with low volume might indicate a lack of demand from retailers and SM to push price further up. From then, we might see SM taking profit subtly. 3) If SM is keen in breaking new high, do take note of the volume. Always remember effort must always translate to result! It can always be profit taking in the process. A combination of No.1and 3 has happened. Last Wednesday, we see a shakeout in the beginning of the session and Sakari closed at $1.50, with huge volume. After 3 shakeouts, finally the SM has pushed them above the $1.50. The strong volume indicates the willingness SM wanting to push the counter up. The question now is how far will Sakari go? In my opinon, anything can happen till their EX-date. People who followed Sakari in the past know how 'sick'

Indoagri - Weakness In VSA Analysis

Image
Did a bad trade today and I am angry at myself because I have seen that pattern before. But emotions get the better over me. When I enter the trade, I feel like exiting immediately. Long story cut short, let me share with you this " Weakness Setup that you might occasionally see in charts" Do remember this pattern that I am going to show so that you do not make the same mistake as me. Read the texts in the chart So what was the grave mistake that I made??? From the bubble text, i wrote about the " Sign of weakness"   in the background. Yes, I entered the following day despite weakness in the background... The trade is awful, not because money was lost but because I entered on impulse. Look at the volume and the long upper tail on 7August...I should have waited for any forms of "Shake out" or test to happen. Below is a definition of "Testing" :: Testing supply Supply coming into the market is dangerous to any pro that is bul

VSA Analysis on Sakari

Image
Above is a technical analysis chart on Sakari. I have given out on looking @ sakari due to its volatility after its share price dropped below $2.00. A lot of times, its share price is just eccentric and you just can't seem to know what is exactly going on. However, I have to take a closer look when some of my client's does purchase it  around 1.2- 1.3. Trading this counter reaps good reward, both positive and negative returns easily =[ Below is analysis of Sakari using VSA. How it was set up before it exploded. Everything is explained over there. Where do I think Sakari is heading to now? Been observing Sakari price today. When i mean observing, i mean scrutinizing its bid/ask spread and the queue tracks. The countless withdraw and fake shorts that the SM has did to drive the price even lower. Monday was considered a rally for us after Friday's excellent US/EU closing. Without a doubt, most counters will gap up and SM will definitel

ChinaMinZhong, IPC Corp, Addval Tech

As previous post stated, ChinaMinZhong is a dead horse. I miss 1 bid in triggering my short sell @ 0.665. =( Likely more downside ahead. IPC Corp, today's volume is incredible, if you chase now, potentially you are in great danger. Likely today or tomorrow, the BB will do their final sell down. Addval Tech, one thing i dont like about chasing penny stocks is that, if you chase the wrong penny stock, thats it for you. In a penny fever, usually you can only chase 1-2 counters. The reason being that you want as much herders as possible.

VSA Analysis On ChinaMinZhong

Image
Good Evening all, Seeing improve traffic in my blog give me the motivation to write and share more. Its not that i really care about all these visits.. Its more of acknowledgement that people do re-visit the blog when i post something new. Whether you are looking for trade ideas, or learning VSA/TA, you are free to comment or send me an email and we can discuss things in-depth. No flamers please. Once again, free publicity to www.tradeguider.com , i shall have a link for them too. No affiliation or whatsoever. If anyone had miss my post on ChinaMinZhong or can't see clearly in this blog. Do email me and I will send you the email that i sent to them on its marked up day. It is a very nice educational email in my opinon. Probably one of the easiest set up to identify. I am kind of lazy to re up-load. I can better spend my time uploading new stuffs. Ok...back to CMZ... Above is a daily chart on CMZ... In the future, what will we expect? 1) Low demand upbar - Gre

ChinaMinZhong

CMZ, no demand bar incoming !!

A lazy Sunday

Spend my Sunday reading more on VSA...i must seriously thank Ken from Tradeguider for giving me the call and the materials that he sent me. Tom and Williams for making the webinar interesting. Though i had already know of the stuffs that you taught. But it dont hurt to solidfy my knowledge. =D If you want to know more about VSA, this is a great website :  http://www.tradeguider.com/newindex.aspx Unfortunately, I am still new to my career and while i definitely been saving up, the software from Tradeguider is not that cheap. =( Nonetheless, I hope more people, who reads my blogs, especially those who can afford can purchase their lastest software! If you need any contacts, i will be happy to pass it to you! They will be coming to Singapore, if  you need more information, go to their website or you can email me too. Lastly, Dukang is in my watch list now. Looking very good!

SunVic Chemical

Image
Good Morning All, After Dowjones rallied so much yesterday, I decided to re look at all the counters again, technically and I saw something interesting. Yes..Sunvic chemical. Pure technical/VSA analysis, NO fundamental analysis as this counter fundamentally is not that good and was heavily oversold after its last quarter ( or the quarter before) miserable financial result. Technically, looking good huh ? =D If we look at in in details....this is what we got..from a volume-spread analysis POV.. If you look at the 3rd picture, i forgot to add caption on the two yellow lines. Distribution is likely at the upthrust green bar, coupled with high volume. Having said that, the potential resistance level that we might face could be 0.360 - 0.375 instead of the accumulation phase. As all my previous posts are, they are not a buy/sell recommendations.

Where The Smart Money Is - Volume Spread Analysis

Image
Below contains 2 separate emails that I sent to my clients on volume spread analysis. Please read from the bottom Do read ------------------------------------------------------------------------------------------------- Hi all, Just want to continue from what we left on earlier on Volume Spread Analysis. Over the past few days, we have seen ChinaMinZhong share price rocketed, not to my amazement. The Smart Money has been accumulating this stock for a very low price of around 0.560 - 0.570 and their effort has paid off as seen from its current share price now of 0.66, high was 0.675 . In the last few days, Stage 3, which is distribution phase had already happen. Will the share price go even higher? Very unlikely... unless they decided to push it even higher. In my opinon, the risk to reward ratio is not attractive at the moment. From the chart below, we seen huge volunme in the past 3 days. These huge volume are profit taking volumes from the Smart Mo

QAF - A dividend rich company

Image
Some Facts on QAF that i shared with my clts.. Before I share more on QAF fundamental's and technical's aspect, below is a background information on QAF. Some company background for QAF QAF Ltd, formerly known as Ben and Company Limited, was incorporated in Singapore on 3 March 1958 as a private company. The Company was converted into a public company on 30 June 1967 and its stock units were quoted on the SGX on 25 August 1967. The principal activities of the Company are those of an investment holding and management company. The principal activities of the Group consist of the manufacture and distribution of bread, bakery and confectionery products; operations of supermarkets; cold storage warehousing; trading and distribution in food, beverages, food related ingredients and commodities; production, processing and marketing of pork and feedmill production; and investment holding. In 2005, QAF bought a 55 percent stake in China Food Industries Limited (‘CFI’), a Singap

Comment On Today's Market

Before i sleep, i checked the DJ index and it was down by 150-160++ points. To my amazement, the DJ index recovered more than i expected. At the moment, 10:43 am, STI is down by 10.14 points, 1 hour has passed and STI seems to be more resilient than many of the indexes. We are still around 3027 points, close to the support/resistance level of the index. Potentially, there are not many counters around to look at. Many of the counters that i spotted previously have already ran up, CMZ, genting HK, sakari has already ran up. Counters that are in my watch list are, YZJ, yoma at the moment. Both seems to be in its accumulation phase. Will be monitoring them closely!

YANGZIJIANG

Have the sellers being flushed down. Gd entry price will be around 0.985. Lets  await.

ChinaMinZhong

ChinaMinZhong - target 615 Best Entry Price : 565-570 Cut loss : 545