VSA Analysis on Sakari

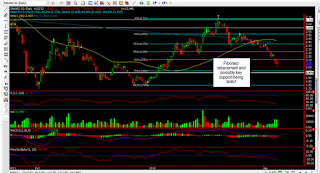
Above is a technical analysis chart on Sakari. I have given out on looking @ sakari due to its volatility after its share price dropped below $2.00. A lot of times, its share price is just eccentric and you just can't seem to know what is exactly going on. However, I have to take a closer look when some of my client's does purchase it around 1.2- 1.3. Trading this counter reaps good reward, both positive and negative returns easily =[ Below is analysis of Sakari using VSA. How it was set up before it exploded. Everything is explained over there. Where do I think Sakari is heading to now? Been observing Sakari price today. When i mean observing, i mean scrutinizing its bid/ask spread and the queue tracks. The countless withdraw and fake shorts that the SM has did to drive the price even lower. Monday was considered a rally for us after Friday's excellent US/EU closing. Without a doubt, most counters will gap up and SM will definitel...